21 Best KPI Dashboard Excel Templates and Samples Download for Free (2024)

KPI Dashboard Excel templates are the graphical representations to track the key data points for maximizing the performance of the business. KPI dashboard templates are available in tabular, pie chart and graph formats for better visualization. Best KPI dashboard templates hold good control in increasing the productivity of an organization. Because these dashboards include all the phenomenal elements which are essential for the upliftment of the business.

Download Top 21 Free KPI Dashboard Excel Templates

Out of multiple KPI Excel templates available in the market, we have chosen the best KPI dashboard templates which definitely increase the productivity. We have picked one KPI template for each section of the business that was recommended by the industry experts.

Here is the list of 21 amazing KPI templates in Excel you have been waiting for:

Page Contents

  • 1. Executive Dashboard Template
  • 2. Business Dashboard Template
  • 3. Financial Dashboard Template
  • 4. Sales Management Dashboard Template
  • 5. Lead Generation Dashboard Template
  • 6. Marketing Dashboard Template
  • 7. Social Media Dashboard Template
  • 8. Digital Marketing Dashboard Template
  • 9. Email Marketing Dashboard Template
  • 10. Project Management Dashboard Template
  • 11. Development Operations (DevOps) Dashboard Template
  • 12. Product Metrics Dashboard Template
  • 13. Supply Chain Dashboard Template
  • 14. Customer Service/Call Center Dashboard Template
  • 15. Web Analytics Dashboard Template
  • 16. SEO Dashboard Template
  • 17. Retail Analysis Dashboard Template
  • 18. E-commerce Dashboard Template
  • 19. HR Dashboard Template
  • 20. Productivity Dashboard Template
  • 21. Insurance Claims Dashboard Template

1. Executive Dashboard Template

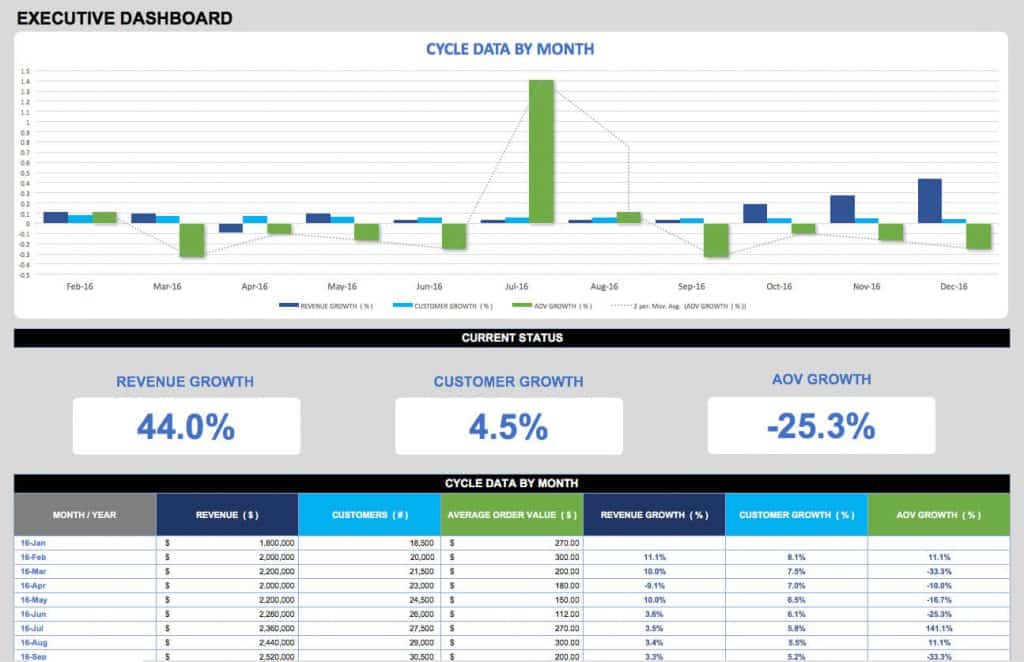
Executive dashboard template describes us about the complete blend of high priority resources and their performance. It provides the measure of success at an executive level for the better functionality of an organization.
21 Best KPI Dashboard Excel Templates and Samples Download for Free (1)

Key Highlights

  • Monthly data (for the complete year).
  • Monthly revenue.
  • Growth in revenue.
  • Total number of customers.
  • Increase in customers.
  • AOV (Average Order Value).
  • Progress in AOV.

Click here to download the Executive KPI dashboard template in Excel format.

2. Business Dashboard Template

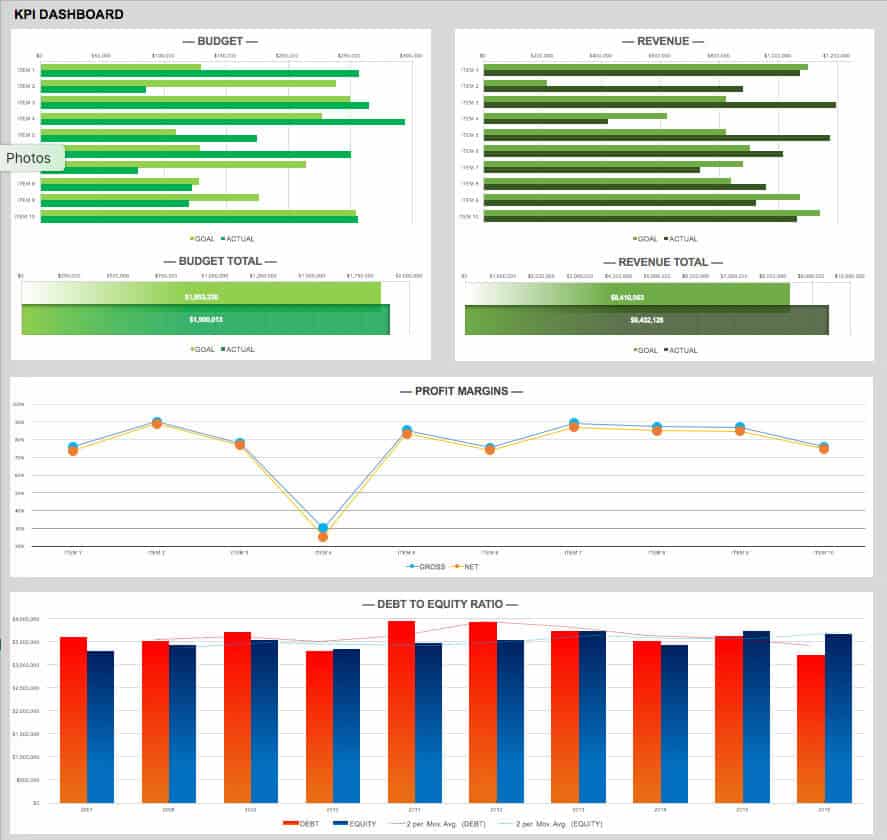
Business dashboard template depicts the overall growth of the business over a tenure, generally in the span of quarters and then cumulative at the end of a year. The goals and actuals of each and every important aspect of business are drafted in this Excel template. The dashboard template displayed here can be very handy. In fact, you can customize it more effectively based on your need.
21 Best KPI Dashboard Excel Templates and Samples Download for Free (2)

Key Highlights

  • Monthly budget goals.
  • Monthly budget actuals.
  • Annual budget goals.
  • Annual budget actuals.
  • Monthly revenue goals.
  • Monthly revenue actuals.
  • Annual revenue goals.
  • Annual revenue actuals.
  • Gross profit margin.
  • Net profit margin.
  • Monthly debt to equity ratio.
  • Annual debt to equity ratio.

Click here to download the Business KPI dashboard Excel template.

3. Financial Dashboard Template

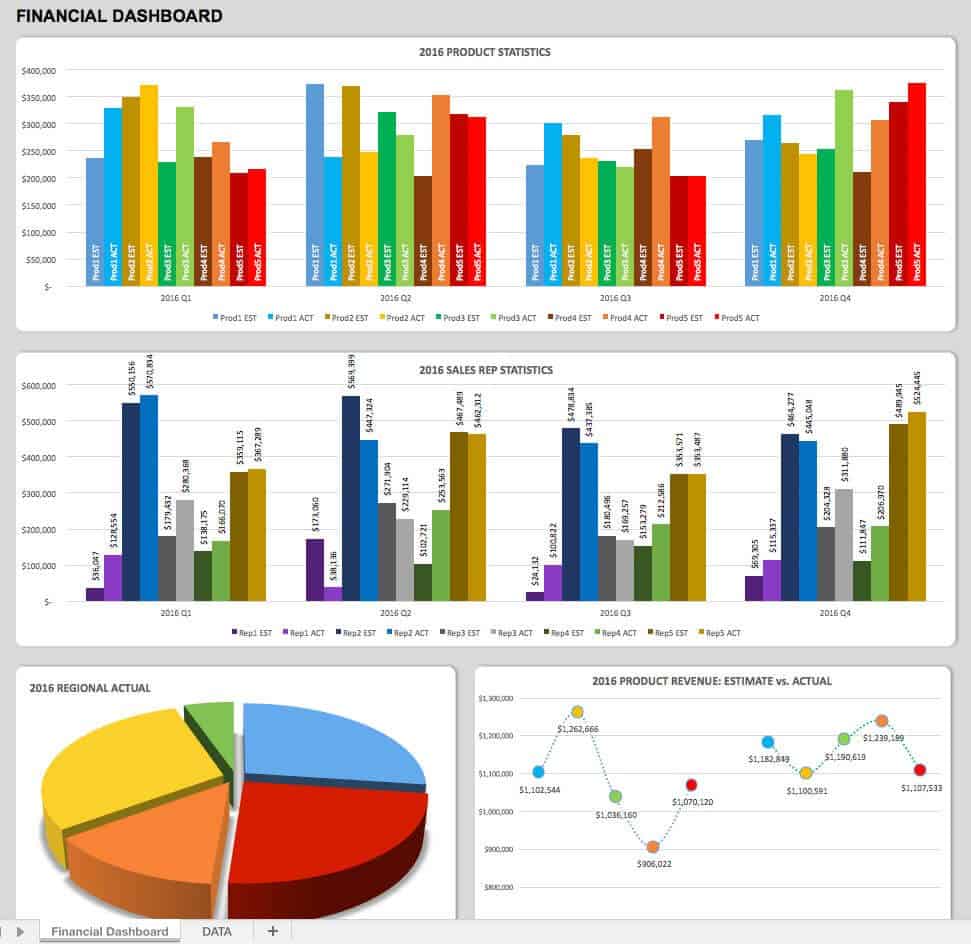
Financial dashboard template is jotted down with all the key financial metrics related to the business are converted into graphs and pie charts and jotted down into the Excel template. This helps in analyzing where the funds are distributed and which product or service is generating more revenue for the business.
21 Best KPI Dashboard Excel Templates and Samples Download for Free (3)

Key Highlights

  • Product revenue estimated/quarter.
  • Product revenue actual/quarter.
  • Annual product revenue estimated.
  • Annual product revenue actual.
  • Regional revenue.

Click here to download sample Financial KPI dashboard Excel template for free.

4. Sales Management Dashboard Template

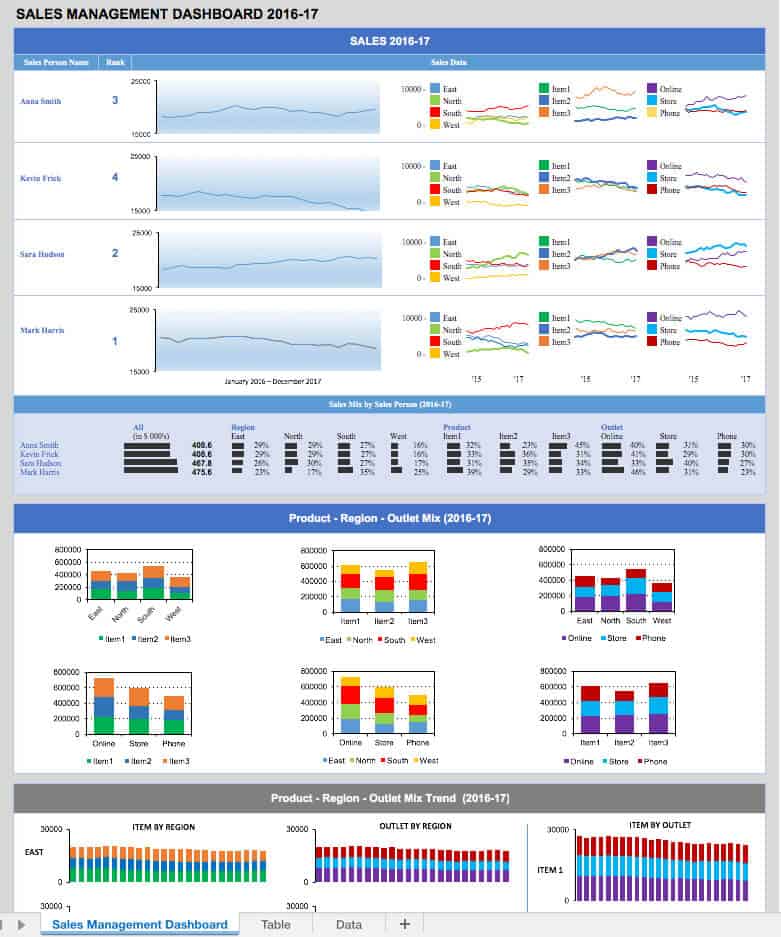
Sales management dashboard template is used to analyze the sales of each and every product across the globe. It is very easy to draw conclusions from the template provided here for download. From the conclusions drawn, you can drive your resources in a more effective and efficient way.
21 Best KPI Dashboard Excel Templates and Samples Download for Free (4)

Key Highlights

  • Referral sales tracking.
  • Region sales data.
  • Item wise sales distribution.
  • Mode of sales happened [Outlet].
  • Item vs Region.
  • Outlet vs Region.
  • Item vs Outlet.

Click here to download sample sales management KPI dashboard Excel template for free.

5. Lead Generation Dashboard Template

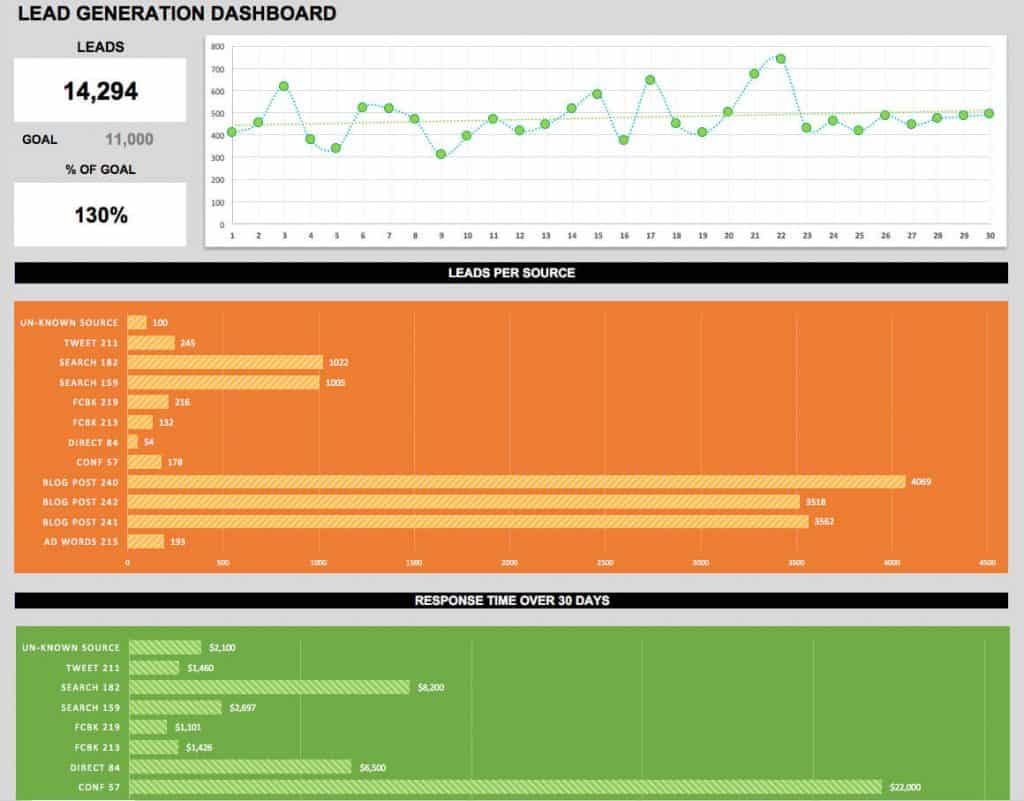
Lead generation dashboard templates can have a better picture of total leads generated and how much percentage of the leads are converted to sales. The follow-up input and its response from each lead are taken into account in developing this dashboard thereby making it more productive.
21 Best KPI Dashboard Excel Templates and Samples Download for Free (5)

Key Highlights

  • Leads generated.
  • Percentage of goal reached.
  • Leads per source.
  • Untargeted leads.
  • Response time (30 days).

Click here to download the Lead generation KPI dashboard Excel template.

6. Marketing Dashboard Template

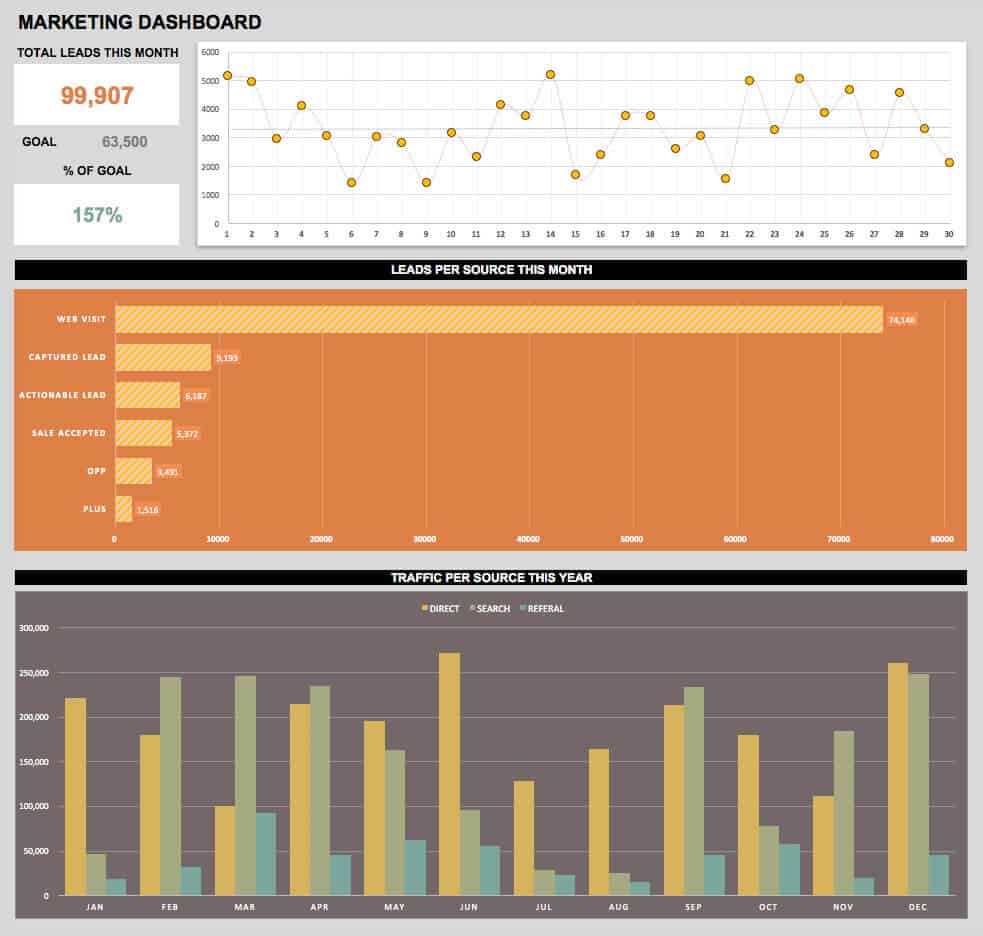
Marketing dashboard template helps you in creating value to the product, getting leads, achieving goals and establishing a brand. Understanding the market and creating plans and strategies which lead to the development of the sales in the market are taken into account in developing a best KPI dashboard for marketing needs. Configure it to your needs and make the best use of this marketing template.
21 Best KPI Dashboard Excel Templates and Samples Download for Free (6)

Key Highlights

  • Leads per source/month.
  • Leads per day/month.
  • Percentage of goals achieved.
  • Traffic per source/month.
  • Annual traffic per source.

Click here to download Sample Marketing KPI dashboard Excel template.

7. Social Media Dashboard Template

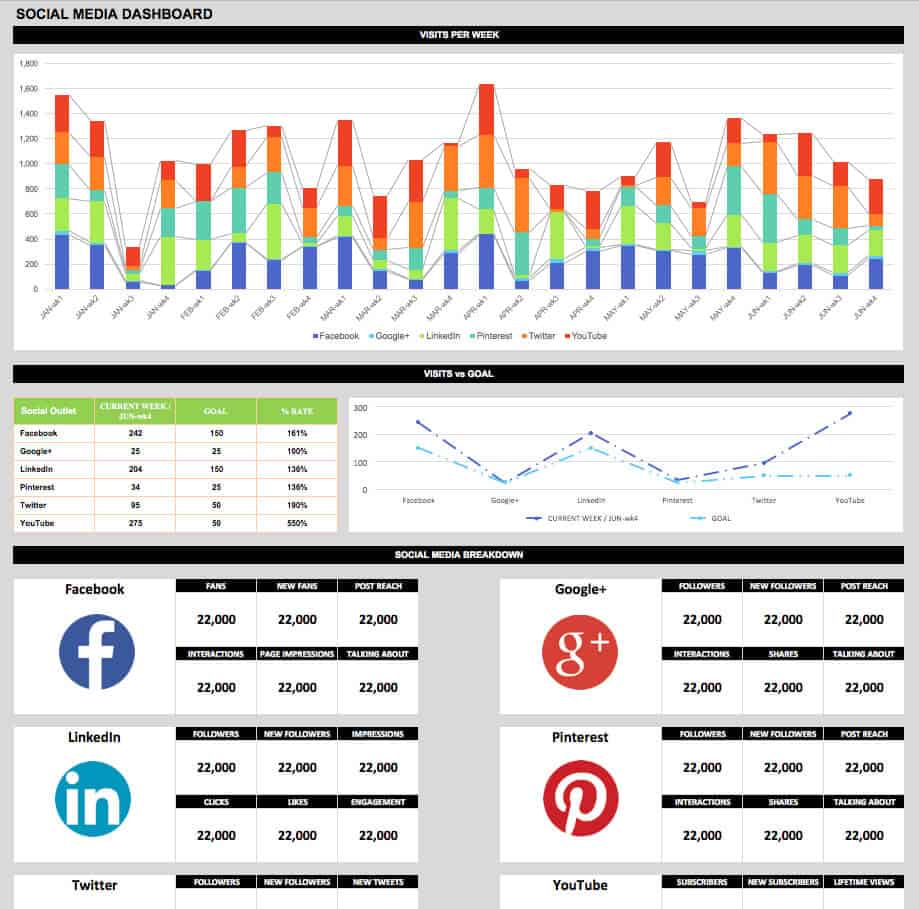
Social media dashboard template helps you in tracking all kinds of audience engagement on social media. This includes various social networking sites like Facebook, Google Plus, Linkedin, YouTube, etc. This dashboard blends all outlet engagement in the spotlight for easy tracking.
21 Best KPI Dashboard Excel Templates and Samples Download for Free (7)

Key Highlights

  • Total visits per week.
  • Total visits for a year.
  • Visits vs Goals.
  • Facebook fans, post reach, interactions, page impressions and talking about.
  • Google plus followers, post reach, interactions, shares and talking about.
  • Linkedin followers, impressions, clicks, likes and engagement.
  • Pinterest followers, post reach, interactions, shares and talking about.
  • Twitter followers, tweets, retweets, mentions and favorites.
  • YouTube subscribers, lifetime views, monthly views, likes, and comments.

Click here to download sample Socialmedia KPI dashboard Exceltemplate for free.

8. Digital Marketing Dashboard Template

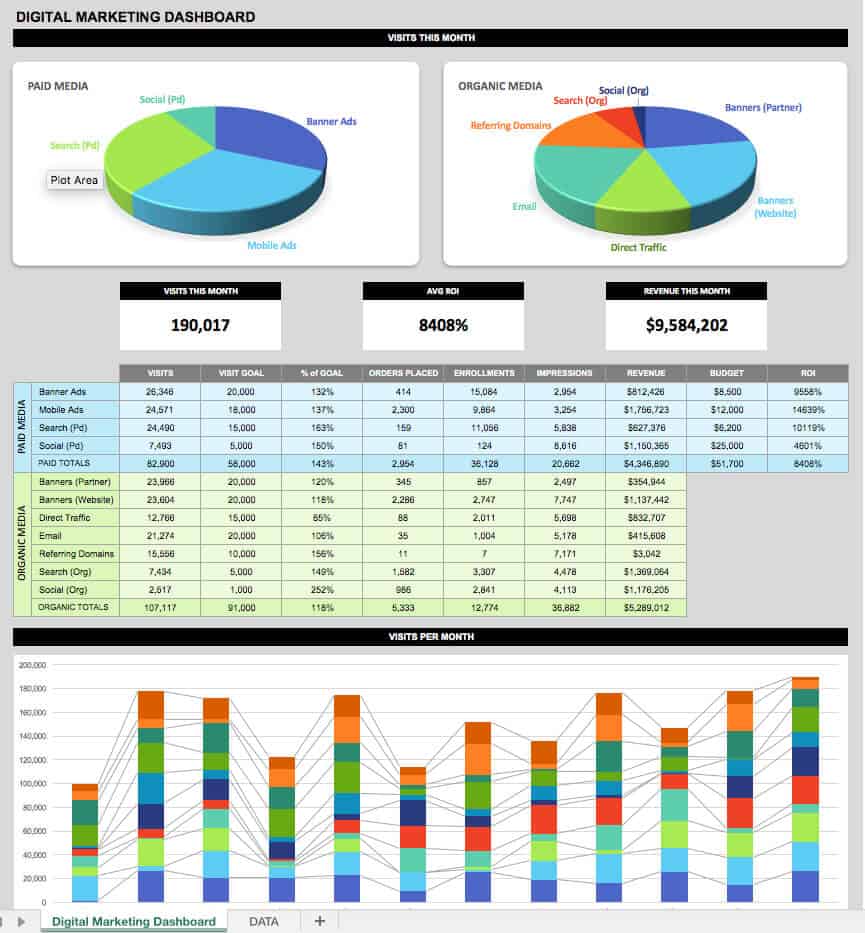
Digital marketing dashboard template is one of the evolving and authoritative mode of marketing for startups as well as industry experts. One who has professional digital marketing skills can reach more customers through organic search. Still, startups find their way into digital marketing through paid search across all digital platforms. All these digital marketing metrics can be viewed and analyzed on a single digital marketing dashboard provided here.
21 Best KPI Dashboard Excel Templates and Samples Download for Free (8)

Key Highlights

  • Paid Media.
  • Organic Media.
  • Views generated/month.
  • ROI (Return On Investment).
  • Revenue/month.
  • Annual views generated.
  • Average ROI.
  • Various types of Organic Reach.
  • Various types of Paid Reach.

Click here to download sample Digital Marketing KPI dashboard Excel template for free.

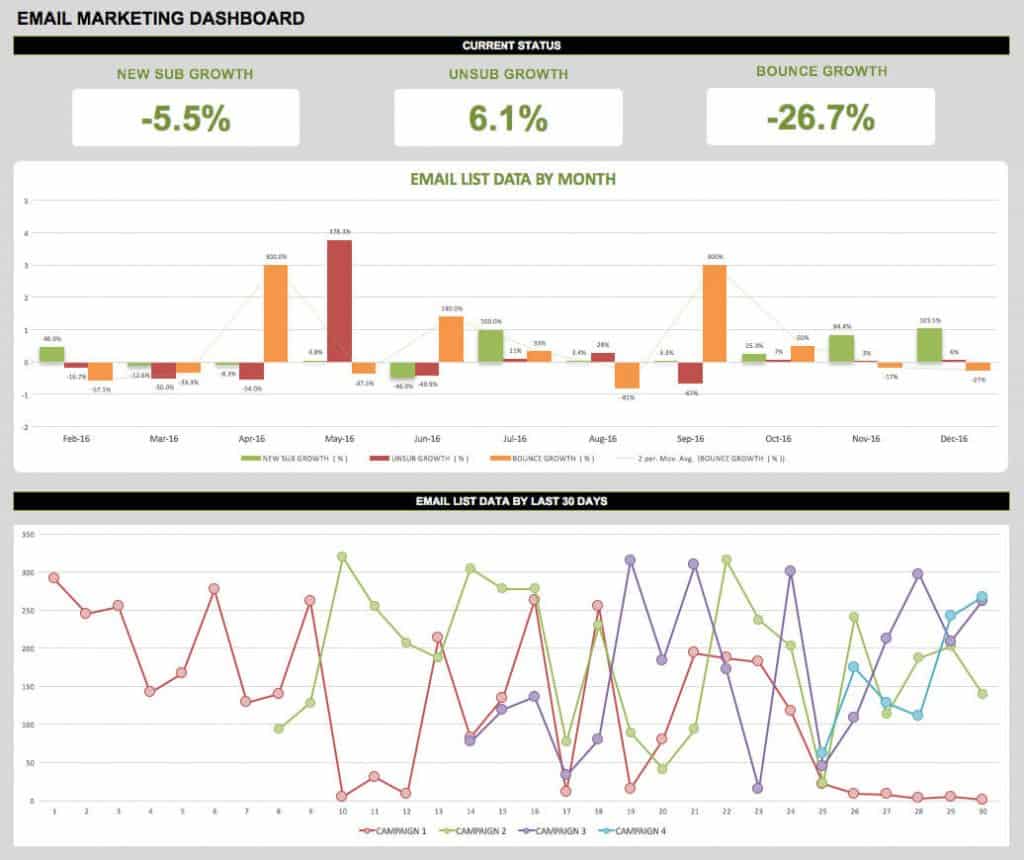
9. Email Marketing Dashboard Template

Email marketing dashboard template includes tracking of leads, creating multiple campaigns and some other key metrics. The template provided here will help you to keep track of all your subscribers and their active/passive engagements etc.
21 Best KPI Dashboard Excel Templates and Samples Download for Free (9)

Key Highlights

  • New subscribers.
  • New subscribers growth.
  • Unsubscribers.
  • Unsubscribers growth.
  • Bounce rate.
  • Bounce rate growth.
  • Email data for all campaigns.

Click here to download sample email marketing KPI dashboard Excel template.

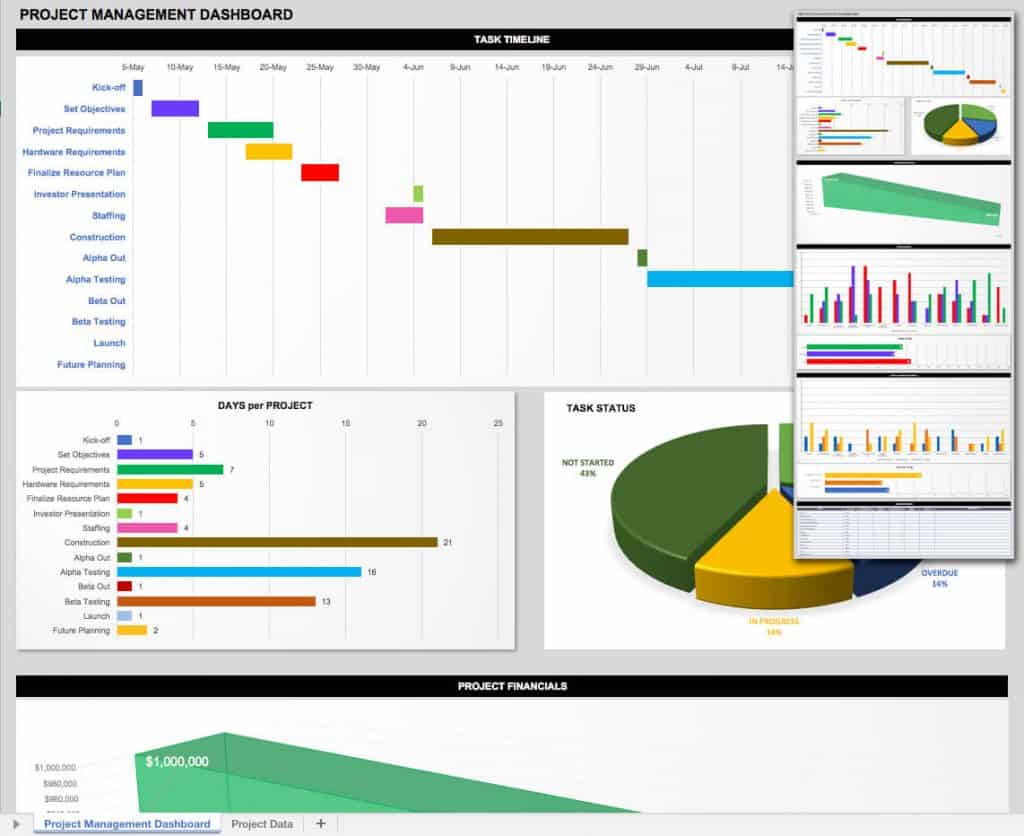
10. Project Management Dashboard Template

Project management dashboard template helps you in meeting project-oriented goals with quantifiable project management metrics like financial status, risk mitigation, deadlines, etc. The template provides here include all the key performance indicators required for project management. Hope you do not need any revisions for the Excel template provided here.
21 Best KPI Dashboard Excel Templates and Samples Download for Free (10)

Key Highlights

  • Exit from Project.
  • Project objectives.
  • Requirements of project.
  • Infrastructure requirements.
  • Planning of resources.
  • Staffing.
  • Alpha out.
  • Alpha testing.
  • Beta out.
  • Beta testing.
  • Launch of product.
  • Future enhancements.
  • Days per project.
  • Task status.
  • Project financials.

Click here to download the project management KPI dashboard Excel template.

11. Development Operations (DevOps) Dashboard Template

DevOps dashboard template is a must for any organization since it is one of the emerging technologies in the current IT industry. Any application or website development involves an agile team working on the operations like development, testing, alpha and beta releases, etc. keeping track of DevOps metrics is highly recommended and hence we are providing a dashboard template for free.

21 Best KPI Dashboard Excel Templates and Samples Download for Free (11)

Key Highlights

  • Unresolved Issues.
  • Resolved Issues.
  • WIP (Work In Progress) Limits.
  • Feature Investment.
  • Bug Investment.
  • Feature vs Bug Investment.
  • Release Tracker.

Click here to download sample DevOps KPI dashboard Excel template for free.

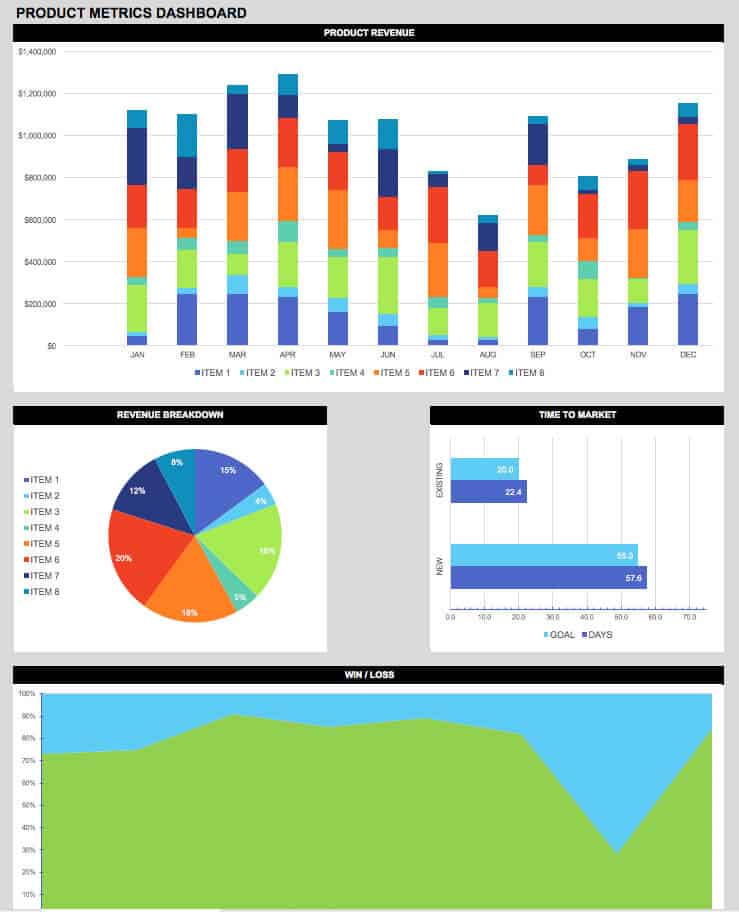
12. Product Metrics Dashboard Template

Product metrics dashboard template includes key metrics like product revenue for each and every item, revenue breakdown and performance of the product. The dashboard template provided here covers all the above and can be customizable as always.
21 Best KPI Dashboard Excel Templates and Samples Download for Free (12)

Key Highlights

  • Product revenue/month.
  • Annual product revenue.
  • Revenue breakdown across items.
  • Time to market.
  • Win/Loss.

Click here to download sample product metrics KPI dashboard Excel template for free.

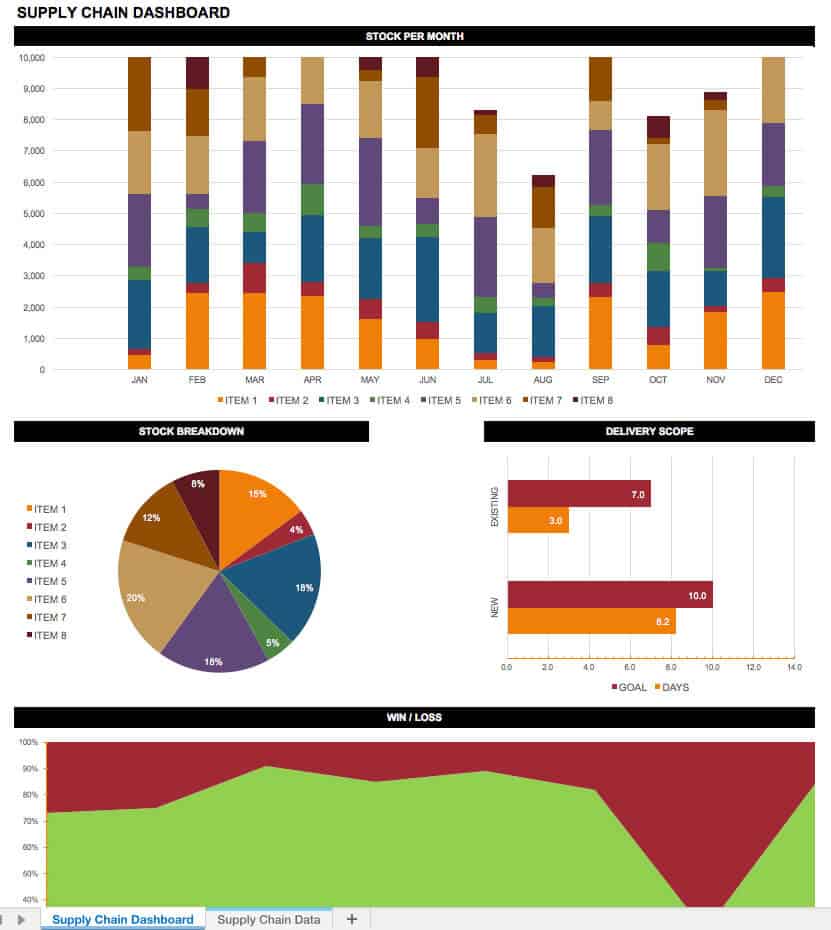
13. Supply Chain Dashboard Template

Supply chain dashboard template helps for the effective management of the flow of goods and services, raw materials required and inventory. In short, it is providing a suitable product at the right time on the spot. The sample download template provided here includes all the KPIs required to view on the dashboard.
21 Best KPI Dashboard Excel Templates and Samples Download for Free (13)

Key Highlights

  • Stock/month.
  • Annual Stock.
  • Individual Stock breakdown.
  • Delivery scope of existing products.
  • Delivery scope of the new products.
  • Win/Loss.

Click here to download sample supply chain KPI dashboard Excel template for free.

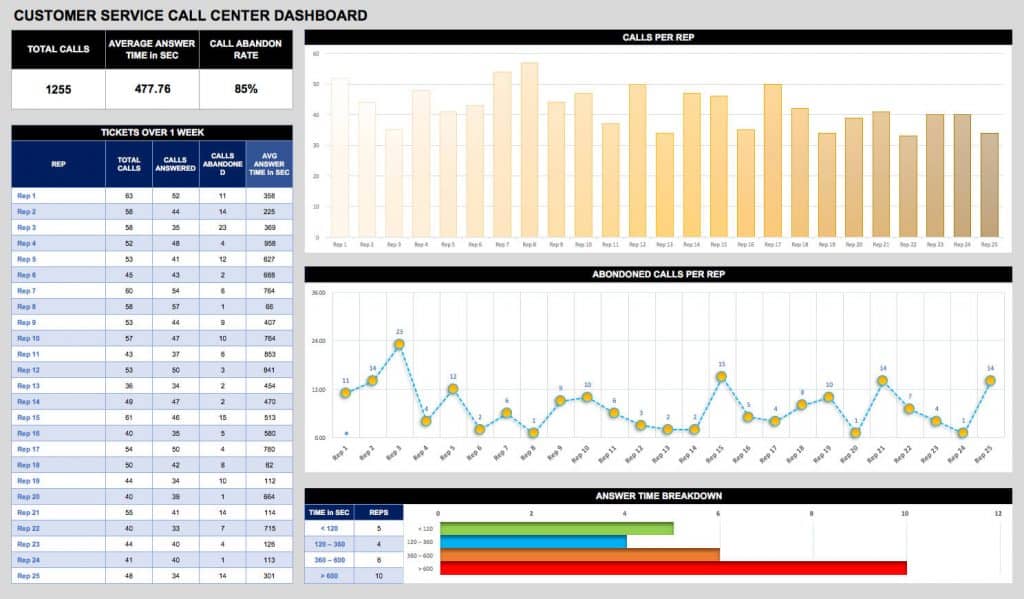
14. Customer Service/Call Center Dashboard Template

Customer service/call center dashboard helps in analyzing the real-time business metrics and it boosts the results for sure if one can act on the drawbacks effectively. One of the best services which keep track of live interaction between customer and business is the call center, hence in need of KPI dashboard template. Customer satisfaction is of high priority in customer service.
21 Best KPI Dashboard Excel Templates and Samples Download for Free (14)

Key Highlights

  • Total Calls.
  • Average response time.
  • Call abandon rate.
  • Calls per rep.
  • Abandoned calls per rep.
  • Answer time breakdown.

Click here to download sample customer service/call center KPI dashboard Excel template for free.

Also Read: Top 7 Best Customer Service KPI Dashboard Excel Templates

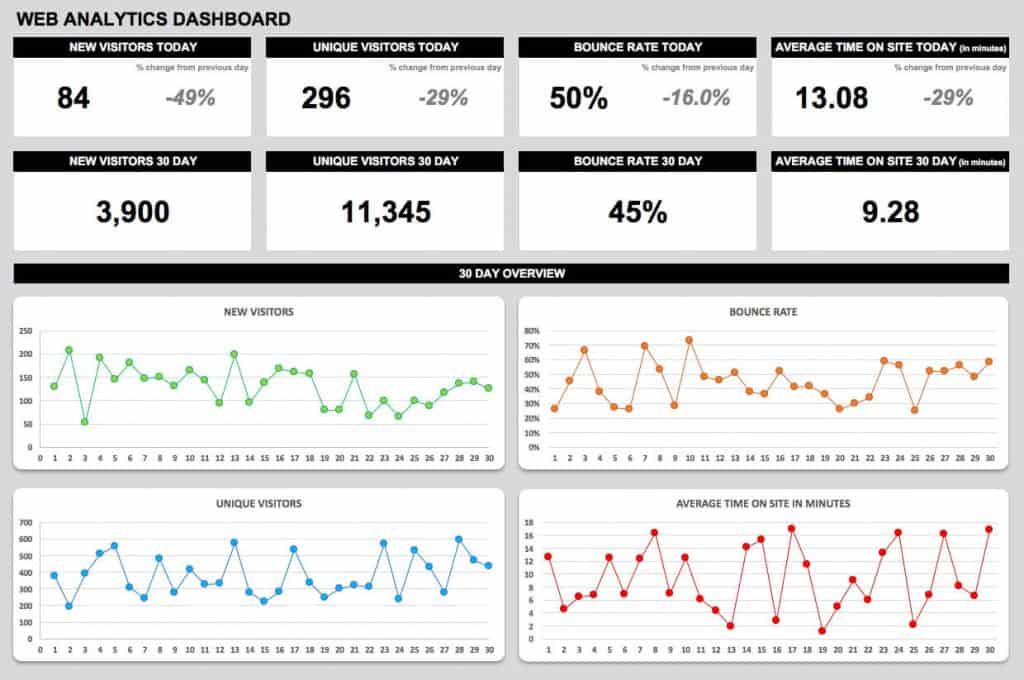
15. Web Analytics Dashboard Template

Web analytics dashboard template helps in robust analysis of the key performance indicators. Giants like Google has their own web analytics tool for easy tracking of blog views, bounce rates, time spent on each page, etc. But you need a blend of all search engine reports to keep track of everything, hence try the template provided below.
21 Best KPI Dashboard Excel Templates and Samples Download for Free (15)

Key Highlights

  • Total Visitors/month.
  • Unique Visitors/month.
  • Returning Visitors/month.
  • Bounce rate.
  • Average time on site.
  • Total visitors/day.
  • Unique visitors/day.
  • Returning visitors/day.

Click here to download sample web analytics KPI dashboard Excel template for free.

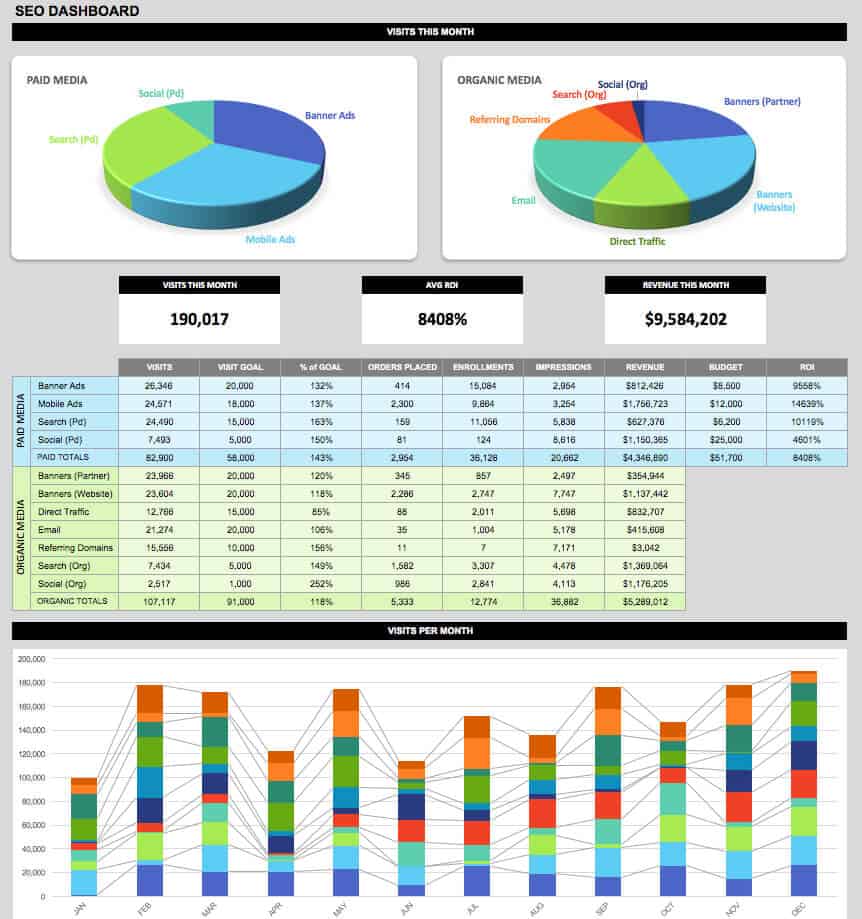
16. SEO Dashboard Template

SEO dashboard template speaks about the key metrics involved in Search Engine Optimization (SEO). It is the technology which is updating its requirements very frequently. If your web page needs to perform well on search engines, it must comply with all those requirements. You need to keep an eye on your competitors to outsmart them. Never begin with an intention you can outrank high authority sites in a month or so, it always takes time. Be patient is the best policy when it comes to SEO.
21 Best KPI Dashboard Excel Templates and Samples Download for Free (16)

Key Highlights

  • Paid Search results.
  • Organic search results.
  • Referring Domains.
  • Email traffic.
  • Campaign Ads.
  • Visits/month.
  • Annual Visits.

Click here to download SEO KPI Excel template.

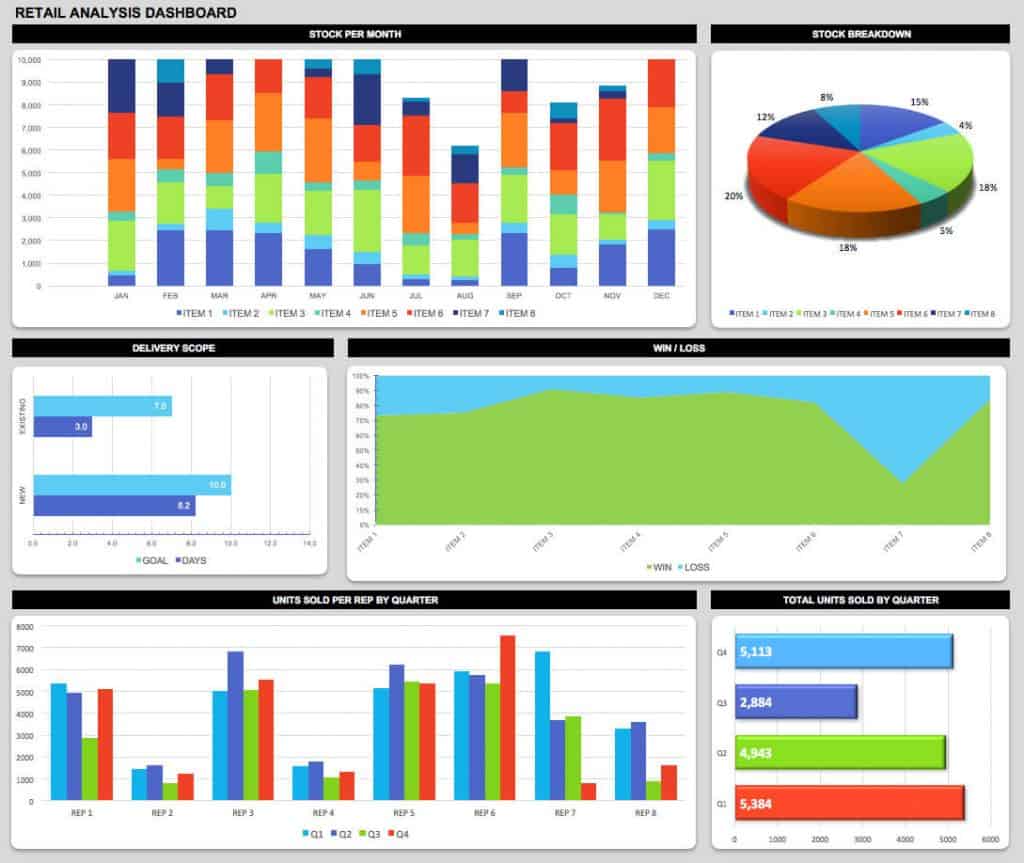
17. Retail Analysis Dashboard Template

Retail analysis dashboard template helps in analyzing the performance of three key pillars – product, customer, and salesperson for the success of the business. Tracking the retail business every week, every month, every quarter, and every year brings out the best suggestions for the future.
21 Best KPI Dashboard Excel Templates and Samples Download for Free (17)

Key Highlights

  • Stock breakdown.
  • Stock/month.
  • Existing delivery scope.
  • New delivery scope.
  • Win/Loss.
  • Quarterly units sold/rep.
  • Annual units sold/rep.
  • Total units sold/quarter.
  • Annual units sold.

Click here t0 download sample retail analysis KPI dashboard Excel Template for free.

18. E-commerce Dashboard Template

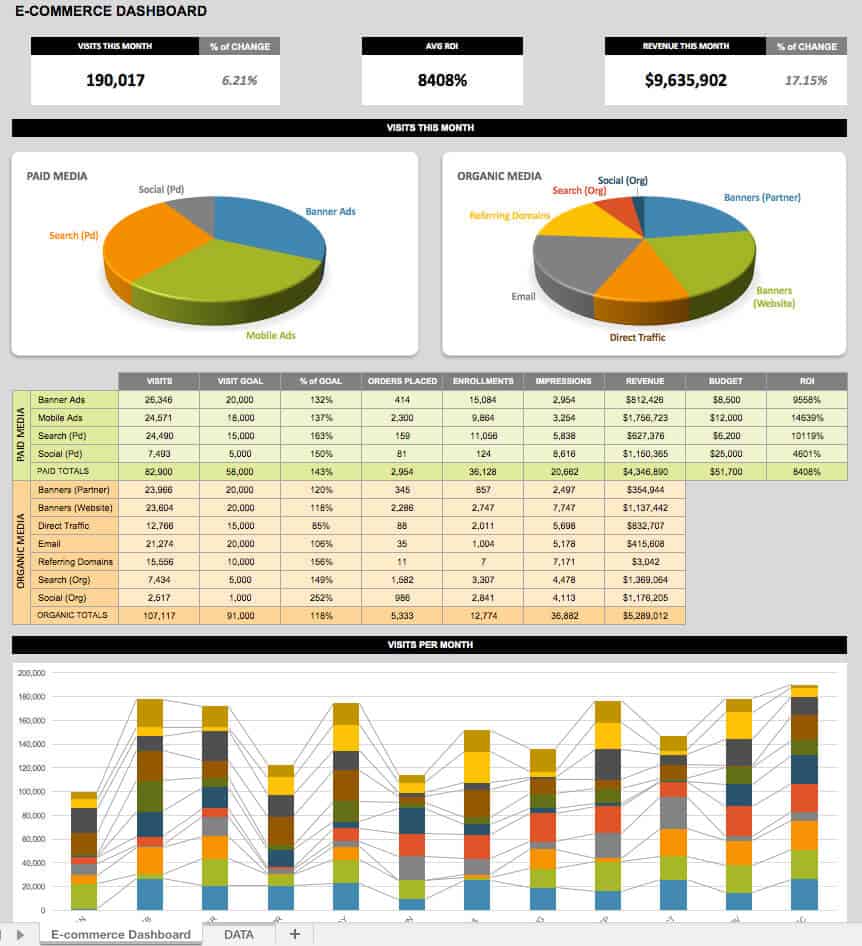
E-commerce dashboard template deals with sellings of various product online. With the advancement in technology, shopping is no longer limited to offline. E-commerce has paved a way for online shopping. Sooner or later all the products will make their entry into the e-commerce field. This is just a digital way of selling products hence the dashboard will be a mixture of SEO KPIs and Sales KPIs.
21 Best KPI Dashboard Excel Templates and Samples Download for Free (18)

Key Highlights

  • Visits/month.
  • ROI.
  • Revenue/month.
  • Paid search.
  • Organic search.
  • Various ad results.

Click here to download sample E-commerce KPI dashboard Excel template for free.

19. HR Dashboard Template

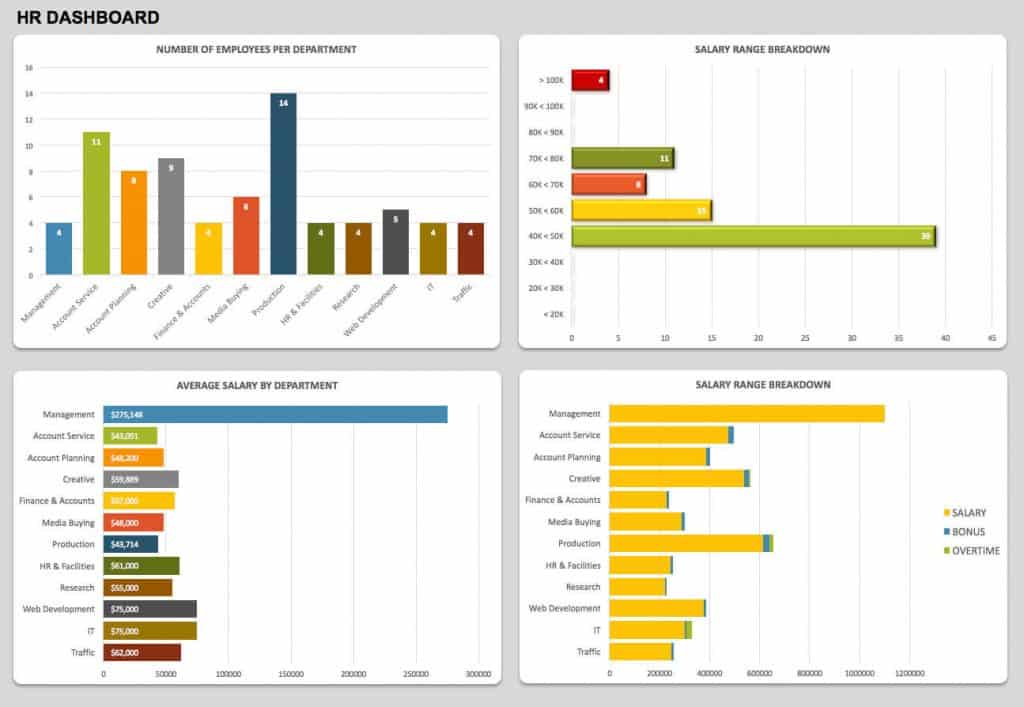
HR dashboard template helps in managing Human Resources for the smooth functioning of any organization. Recruitment of new employees, taking care of them, and employee satisfaction are some of the KPIs for achieving better results. Employees are the huge assets to the organization, as long as they are satisfied the organization has extended support from them.
21 Best KPI Dashboard Excel Templates and Samples Download for Free (19)

Key Highlights

  • Employees per department.
  • Salary breakdown.
  • Average salary by the department.
  • Bonus.
  • Overtime.

Click here to download HR KPI dashboard Excel template for free.

20. Productivity Dashboard Template

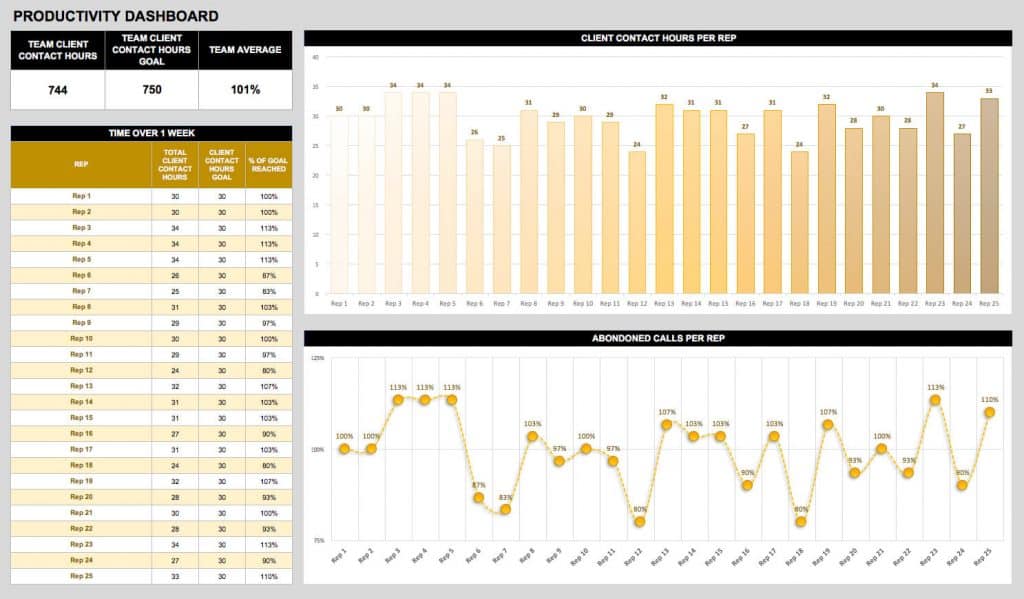
Productivity dashboard template helps in measuring is the KPIs to portray whether an organization is running up to the mark or not. The productivity of an individual affects the productivity of the team, which in turn impacts the productivity of a vertical and finally, it has a huge impact at an organizational level. Hence productivity dashboard should be able to depict everything at the highest level of accuracy.
21 Best KPI Dashboard Excel Templates and Samples Download for Free (20)

Key Highlights

  • Expected client contact hours.
  • Actual client contact hours.
  • Client contact hours per rep.
  • Abandoned calls per rep.
  • Average hours.

Click here to download sample productivity KPI dashboard Excel template for free.

21. Insurance Claims Dashboard Template

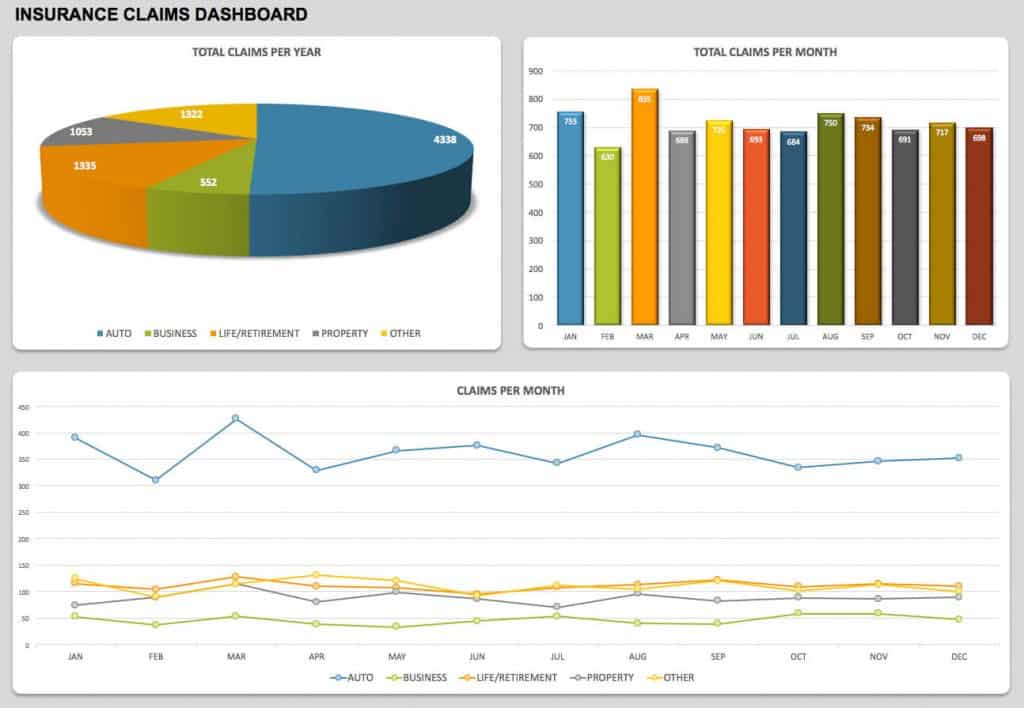
Insurance claims dashboard template which provides you complete details about various types of insurance claims is inevitable. Any organization have to safeguard their employees and should be able to contribute to providing a better lifestyle. It is again a financial burden to the organization, but they should never neglect this.
21 Best KPI Dashboard Excel Templates and Samples Download for Free (21)

Key Highlights

  • Automobile insurance claims.
  • Business insurance claims.
  • Life insurance claims.
  • Property insurance claims.
  • Other insurance claims.
  • Total claims/month.
  • Total claims/year.

Click here to download insurance claims KPI dashboard Excel template for free.

Final thoughts on KPI templates

All best KPI dashboard Excel templates listed here will meet the needs of any organization ranging from a low-level organization (startups) to high-level organization (well established).

Hope you find the most important KPI dashboard Excel templates which you want to download. If you are searching for any other KPI template which you didn’t find here, please let us know through the comments section. Appreciate our efforts by sharing this article on social media and let others know the importance of KPI.

21 Best KPI Dashboard Excel Templates and Samples Download for Free (2024)

FAQs

How do I create a simple KPI dashboard in Excel? ›

Create a KPI
  1. In Data View, click the table containing the measure that will serve as the Base measure. ...
  2. Ensure that the Calculation Area appears. ...
  3. In the Calculation Area, right-click the calculated field that will serve as the base measure (value), and then click Create KPI.

Where can I get free Excel templates? ›

Free Excel for the web templates on Office.com
  • Go to Office.com.
  • Click Templates at the top of the page.
  • On the Templates page, click Excel. ...
  • Click the template you want, click Edit in Browser, sign in if prompted, and then click Continue.

What is the best KPI dashboard? ›

Some of the best KPI dashboard software for KPI tracking are Datapad, Klipfolio, Geckoboard, Databox, Mixpanel, Arena Calibrate, Zoho Analytics, Mode, InetSoft, Tableau, Praxie, Smarten Augmented Analytics and DashThis.

Is Excel dashboard free? ›

An Excel dashboard is a single page that consolidates valuable information into a summary, often using charts and other visuals to help users digest key data and make important business decisions. A free Excel dashboard template can help you make sense of results and improve strategic planning.

How do I install a template in Excel? ›

To base the workbook on an installed template, click Installed Templates, and then under Installed Templates, double-click the template that you want to use. To base the workbook on a template that you created, click My templates, and then on the My Templates tab, double-click the template that you want to use.

Is there a free version of Excel? ›

Option 2 – Use on mobile. Perhaps again in response to Google, Microsoft's Office mobile applications are completely free and available across most modern smartphones, tablets and even foldables. You can download the Microsoft Excel app for Android and iOS.

Is there a KPI software? ›

KPI software is a tool that automates the tracking of key performance indicators (KPIs) and presents them in easy-to-understand dashboards. This helps businesses create, manage, visualize, and analyze KPIs and ascertain how they are performing against targets, strategic goals, or objectives.

What makes a good KPI dashboard? ›

Include Only the Relevant KPIs

To track the chosen metrics more easily, avoid going overboard with the number of KPIs - only use a selection of most relevant KPIs for each dashboard you're planning to create. Too many KPIs may cause chaos and make you lose relevant information in the analysis.

Which KPI dashboard proved to be the most important to keep track of your small business company goals? ›

Financial Dashboard

Another of the best KPIs dashboards for small businesses is a financial dashboard. It helps visualize, track, and analyze essential financial KPIs to help teams understand how well they are meeting their financial goals and how the cash is flowing.

How do I download Excel dashboard? ›

Data Dashboard - Download Data to Excel - YouTube

What is a dashboard in Excel and what are the best practices for using one? ›

The Excel Dashboard provides an overview of metrics and other data points in one place. In simple terms, dashboards are visual representations of data. They mostly consist of charts and graphs, thereby grabbing the user's attention. Looking at raw Excel data can be boring.

What is VBA in Excel? ›

VBA stands for Visual Basic Analysis. Excel VBA is Microsoft's programming language for Office applications such as MS-Excel, MS-Word, and MS-Access. Macros are what most people who write VBA code use.

How do I create a dynamic dashboard in Excel? ›

Create an Excel Dashboard in 8 Simple Steps
  1. Start with a Clean Dataset.
  2. Format data as a Table.
  3. Create the first Pivot table and Pivot Charts.
  4. Create Multiple Pivot table and Pivot Charts for other variables.
  5. Assemble the Excel dashboard.
  6. Add Slicers & Timelines.
  7. Connect Slicers to data.
  8. Update the Excel Dashboard.

What is a slicer in Excel? ›

Slicers provide buttons that you can click to filter tables, or PivotTables. In addition to quick filtering, slicers also indicate the current filtering state, which makes it easy to understand what exactly is currently displayed.

What is the difference between dashboard and KPI? ›

Key Performance indicators (KPIs) are individual metrics that can be displayed on a dashboard to track key measurements. You can think of them as a single important number that is displayed in large text. Dashboards are a collection of Insights and KPIs put together on a page.

How do I create a KPI template? ›

How to write and develop key performance indicators
  1. Write a clear objective for each one.
  2. Share them with all stakeholders.
  3. Review them on a weekly or monthly basis.
  4. Make sure they are actionable.
  5. Evolve them to fit the changing needs of the business.
  6. Check to see that they are attainable (but add a stretch goal)

How do I find Microsoft Excel templates? ›

Find Excel Templates to Use - YouTube

Where are templates on Excel? ›

Open Microsoft Excel. On the right side of the Home tab, click More templates. Scroll through the displayed list of templates to find the one that suits your needs. If you don't find one you like, you can use the Search for online templates text field to see if there is a template online for what you need.

How do you copy a template in Excel? ›

Right click on the worksheet tab and select Move or Copy. Select the Create a copy checkbox. Under Before sheet, select where you want to place the copy. Select OK.

What program is better than Excel? ›

LibreOffice

LibreOffice is an open source Excel alternative that has been derived from the original Openoffice.org, just like Apache Open Office. And it's not just Excel, LibreOffice is an alternative to the whole Microsoft Office application.

How can I download Excel on my computer for free? ›

Sign in to download Office
  1. Go to www.office.com and if you're not already signed in, select Sign in. ...
  2. Sign in with the account you associated with this version of Office. ...
  3. After signing in, follow the steps that match the type of account you signed in with. ...
  4. This completes the download of Office to your device.

Which spreadsheet is easiest to use? ›

Google Sheets

Google Sheets is also the most easily manageable alternative to Excel, with a layout and functionality both easy to get used to if you're already familiar with its Microsoft counterpart.

Is Google Excel free? ›

Google Sheets is free, and it's bundled with Google Drive, Docs, and Slides to share files, documents, and presentations online. It includes almost all of the same spreadsheet functions—if you know how to use Excel, you'll feel at home in Google Sheets.

How much does Excel cost? ›

Office 365 Personal: $6.99/month or $69.99/year Office 365 Home: $9.99/month or $99.99/year Office Home & Student 2019: $149.99 one-time Office 365 Business: $8.25/user/month (annual commitment required) Office 365 Business Premium: $12.50/user/month (annual commitment required) Office 365 Business Essentials: $5/month ...

How can I get a free spreadsheet? ›

  1. Google Sheets (Free) has become as well-known as Microsoft Excel. ...
  2. Calc (Free), part of LibreOffice, is a robust spreadsheet program for Windows, macOS, and Linux users.
16 Mar 2022

What is simple KPI? ›

A simple, easy-to-use dashboard that takes complex data and turns it into accessible and understandable visuals. Create top-level summaries of your KPIs to share across your organization. Choose from various charts, graphs, league tables, and widgets that help communicate an accurate understanding of your data.

What are KPI tools? ›

WHAT ARE KPI TOOLS? KPI tools are a business reporting solution used by companies to track, monitor, and generate actionable insights from key performance indicators specific to the company's business objectives to achieve sustainable business development and, ultimately, profit.

How many KPI does a dashboard have? ›

In short, the optimal number of KPIs in an executive dashboard should be between three and ten. It's not the place for irrelevant KPIs to the managers like bounce rate or average time spent.

What should a dashboard contain? ›

Most of the time, you're going to be using a combination of numbers, bars, lines and tables and not much else.
  • Group your related metrics. ...
  • Be consistent. ...
  • Use size and position to show hierarchy. ...
  • Give your numbers context. ...
  • Use clear labels your audience will understand. ...
  • Remember it's for people. ...
  • Keep evolving your dashboards.

What is the best way to show KPI and high impacting basic numbers? ›

Oftentimes, a BI or analytics tool is a great way to track your progress against your KPIs. This way, you can build a metric (like leads) and easily and quickly see your progress in a data visualization (and share it with others on your team or across your organization, too!

What are the 4 main KPIs? ›

Anyway, the four KPIs that always come out of these workshops are:
  • Customer Satisfaction,
  • Internal Process Quality,
  • Employee Satisfaction, and.
  • Financial Performance Index.
25 Sept 2013

What is the most important KPI? ›

The 5 Most Important Financial KPIs That Drive Business Strategy
  • Sales Growth Rate. Performance Indicators.
  • Revenue Concentration. Performance Indicators.
  • Net Profit Margin. Performance Indicators.
  • Accounts Receivable Turnover. Performance Indicators.
  • Working Capital.

What can I use to track KPIs? ›

The most common tool for tracking KPIs is web analytics. Google Analytics is able to track a myriad of data, from website performance to new subscribers, to sales.

How do you make a beautiful dashboard in Excel? ›

How to create an Excel Dashboard
  1. Figure out which charts best represent your data. You know how we just said you'll be faced with tons of options to represent your data? ...
  2. Filter your data. ...
  3. Build your chart. ...
  4. Select your data. ...
  5. Double-check your data. ...
  6. Polish your chart. ...
  7. Repeat the process for other data.

How do I download dashboard? ›

Downloading at the Dashboard Level

Click the Dashboard Actions (three dots) icon at the top-right of the dashboard and click Download. The Download pop-up appears. Select the paper size or accept the default of Fit Page to Dashboard.

What is KPI dashboard? ›

What are KPI dashboards? KPI dashboards are tools that unite data sources and provide at-a-glance visual feedback showing how your business is performing against your key performance indicators (KPIs).

Does Excel have a dashboard function? ›

Summary. The Excel Dashboard is used to display overviews of large data tracks. Excel Dashboards use dashboard elements like tables, charts, and gauges to show the overviews. The dashboards ease the decision-making process by showing the vital parts of the data in the same window.

What kind of charts can you create using a dashboard in Excel? ›

If you want to compare things, you may choose a bar chart, pie chart, line chart, or scatter plot. If you want to show distribution, you may go with a column chart, scatter plot or line chart. If you want to show trends over time, a line chart is a great option.

Is VBA still used in Excel? ›

Yes, VBA is still useful and used by individuals interacting with Microsoft products. However, newer languages such as Python, C#, or R can be used to code in place of VBA. In addition, new tools such as Power Query may be able to perform tasks that could previously only be performed when using VBA.

Is VBA difficult to learn? ›

With the right training, learning Microsoft VBA is easy. The Microsoft VBA Introduction course makes it easy to learn VBA primarily for Excel. There's also an Advanced VBA training course if you're looking for a higher difficulty level.

What is SQL in Excel? ›

In most cases, people use SQL (short for Structured Query Language). SQL tells a database what data you want to view and manipulate with calculations. By moving some of your initial calculations to SQL, you can pare down the amount of data you export.

How do you create a KPI format? ›

Steps to follow to write effective KPIs
  1. Step 1 – Identify your organization's strategic objectives. ...
  2. Step 2 – Define the criteria for success. ...
  3. Step 3: Develop key performance questions. ...
  4. Step 4- Collect supporting data. ...
  5. Step 5: Determine what to measure and how frequently you should measure. ...
  6. Step 5: Develop the KPIs.

How do you perform a performance tracker in Excel? ›

Click the "Formulas" tab, click "AutoSum." Highlight the cells between this cell and the employee's name – in this example, for each day of the week – and press Enter. AutoSum will automatically add up all of the numbers when you enter them beside the employee's name.

How do I create a speedometer chart in Excel? ›

To create a SPEEDOMETER in Excel, you can use the below steps: First of all, go to Insert Tab ➜ Charts ➜ Doughnut Chart (with this you'll get a blank chart). Now, right-click on the chart and then click on “Select Data”. In the “Select Data” window, click on “Legend Entries” and enter “Category” in the name input bar.

What is a dashboard in Excel and what are the best practices for using one? ›

The Excel Dashboard provides an overview of metrics and other data points in one place. In simple terms, dashboards are visual representations of data. They mostly consist of charts and graphs, thereby grabbing the user's attention. Looking at raw Excel data can be boring.

What are the 4 main KPIs? ›

Anyway, the four KPIs that always come out of these workshops are:
  • Customer Satisfaction,
  • Internal Process Quality,
  • Employee Satisfaction, and.
  • Financial Performance Index.
25 Sept 2013

How do I create a master tracker in Excel? ›

Steps for creating Excel tracker
  1. Step 1: Create a table with below columns. Just type the headings, select them and press CTRL+T.
  2. Step 2: Set up data validation rules. This is the important bit. ...
  3. Step 3: Highlight what matters with conditional formatting.
17 Mar 2020

How do I create a dynamic dashboard in Excel? ›

Create an Excel Dashboard in 8 Simple Steps
  1. Start with a Clean Dataset.
  2. Format data as a Table.
  3. Create the first Pivot table and Pivot Charts.
  4. Create Multiple Pivot table and Pivot Charts for other variables.
  5. Assemble the Excel dashboard.
  6. Add Slicers & Timelines.
  7. Connect Slicers to data.
  8. Update the Excel Dashboard.

Which chart is similar to the speedometer chart in Excel? ›

A gauge chart (or speedometer chart) combines a Doughnut chart and a Pie chart in a single chart. If you are in a hurry, simply download the Excel file. This is what the spreadsheet looks like.

Does Excel have gauge charts? ›

Creating a Simple Gauge Chart

Step 1 − Select the data – C5:C7. Step 2 − Insert a Pie chart. Step 3 − Right click on the chart. Step 4 − Select Format Data Series from the dropdown list.

What is dashboard reporting in Excel? ›

A dashboard is a visual representation of key metrics that allow you to quickly view and analyze your data in one place. Dashboards not only provide consolidated data views, but a self-service business intelligence opportunity, where users are able to filter the data to display just what's important to them.

Does Excel have a dashboard function? ›

Summary. The Excel Dashboard is used to display overviews of large data tracks. Excel Dashboards use dashboard elements like tables, charts, and gauges to show the overviews. The dashboards ease the decision-making process by showing the vital parts of the data in the same window.

What kind of charts can you create using a dashboard in Excel? ›

If you want to compare things, you may choose a bar chart, pie chart, line chart, or scatter plot. If you want to show distribution, you may go with a column chart, scatter plot or line chart. If you want to show trends over time, a line chart is a great option.

Top Articles
Latest Posts
Article information

Author: Stevie Stamm

Last Updated:

Views: 5811

Rating: 5 / 5 (80 voted)

Reviews: 95% of readers found this page helpful

Author information

Name: Stevie Stamm

Birthday: 1996-06-22

Address: Apt. 419 4200 Sipes Estate, East Delmerview, WY 05617

Phone: +342332224300

Job: Future Advertising Analyst

Hobby: Leather crafting, Puzzles, Leather crafting, scrapbook, Urban exploration, Cabaret, Skateboarding

Introduction: My name is Stevie Stamm, I am a colorful, sparkling, splendid, vast, open, hilarious, tender person who loves writing and wants to share my knowledge and understanding with you.